Version v0.12 of Metabase is no longer supported. Check out the docs for the current stable version, Metabase v0.63.
While tables are useful for looking up information or finding specific numbers, it’s usually easier to see trends and make sense of data overall using charts.
In Metabase, an answer to a question can be visualized in a number of ways:
A few notes on the map options:
To change how the answer to your question is displayed, click on the Visualization dropdown menu beneath the question builder bar.
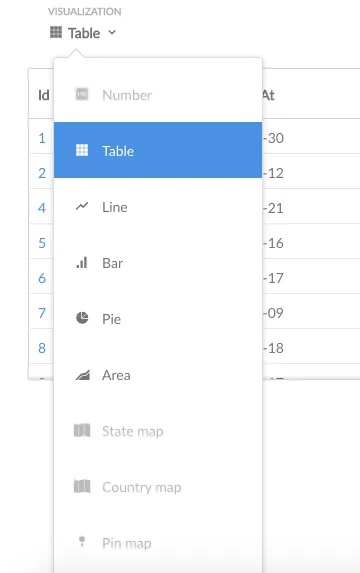
If a particular visualization doesn’t really make sense for your answer, the format option will appear faded in the dropdown menu.
Once a question is answered, you can save or download the answer, or add it to a dashboard.
Learn more about Sharing Answers next.


