Version v0.20 of Metabase is no longer supported. Check out the docs for the current stable version, Metabase v0.63.
While tables are useful for looking up information or finding specific numbers, it’s usually easier to see trends and make sense of data overall using charts.
In Metabase, an answer to a question can be visualized in a number of ways:
To change how the answer to your question is displayed, click on the Visualization dropdown menu beneath the question builder bar.
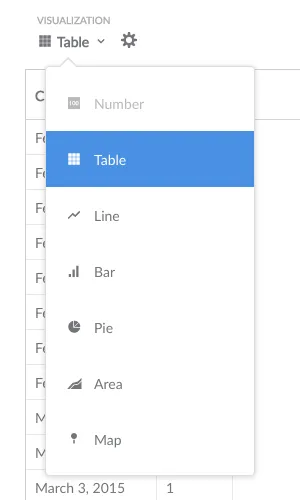
If a particular visualization doesn’t really make sense for your answer, the format option will appear faded in the dropdown menu.
Once a question is answered, you can save or download the answer, or add it to a dashboard.
Each visualization type has its own advanced options you can tweak. Just click the gear icon next to the visualization selector. Here’s an overview of what you can do:
The options for numbers include adding prefixes or suffixes to your number (so you can do things like put a currency symbol in front or a percent at the end), setting the number of decimal places you want to include, and multiplying your result by a number (like if you want to multiply a decimal by 100 to make it look like a percent).
The table options allow you to hide and rearrange fields in the table you’re looking at.
These three charting types have very similar options, which are broken up into the following:
The options for pie charts let you choose which field to use as your measurement, and which one to use for the pie slices. You can also customize the pie chart’s legend.
When you select the Map visualization setting, Metabase will automatically try and pick the best kind of map to use based on the table or result you’re currently looking at. Here are the maps that Metabase uses:
When you open up the Map options, you can manually switch between a region map (i.e., United States or world) and a pin map. (And don’t worry — a flexible way to add custom maps of other countries and regions will be coming soon.) If you’re using a region map, you can also choose which field to use as the measurement, and which to use as the region (i.e. State or Country).
Now let’s learn about sharing and organizing your saved questions.


