





Version v0.48 of Metabase is no longer supported. Check out the docs for the current stable version, Metabase v0.63.
Combo charts
Combo charts let you combine bars and lines (or areas) on the same chart.
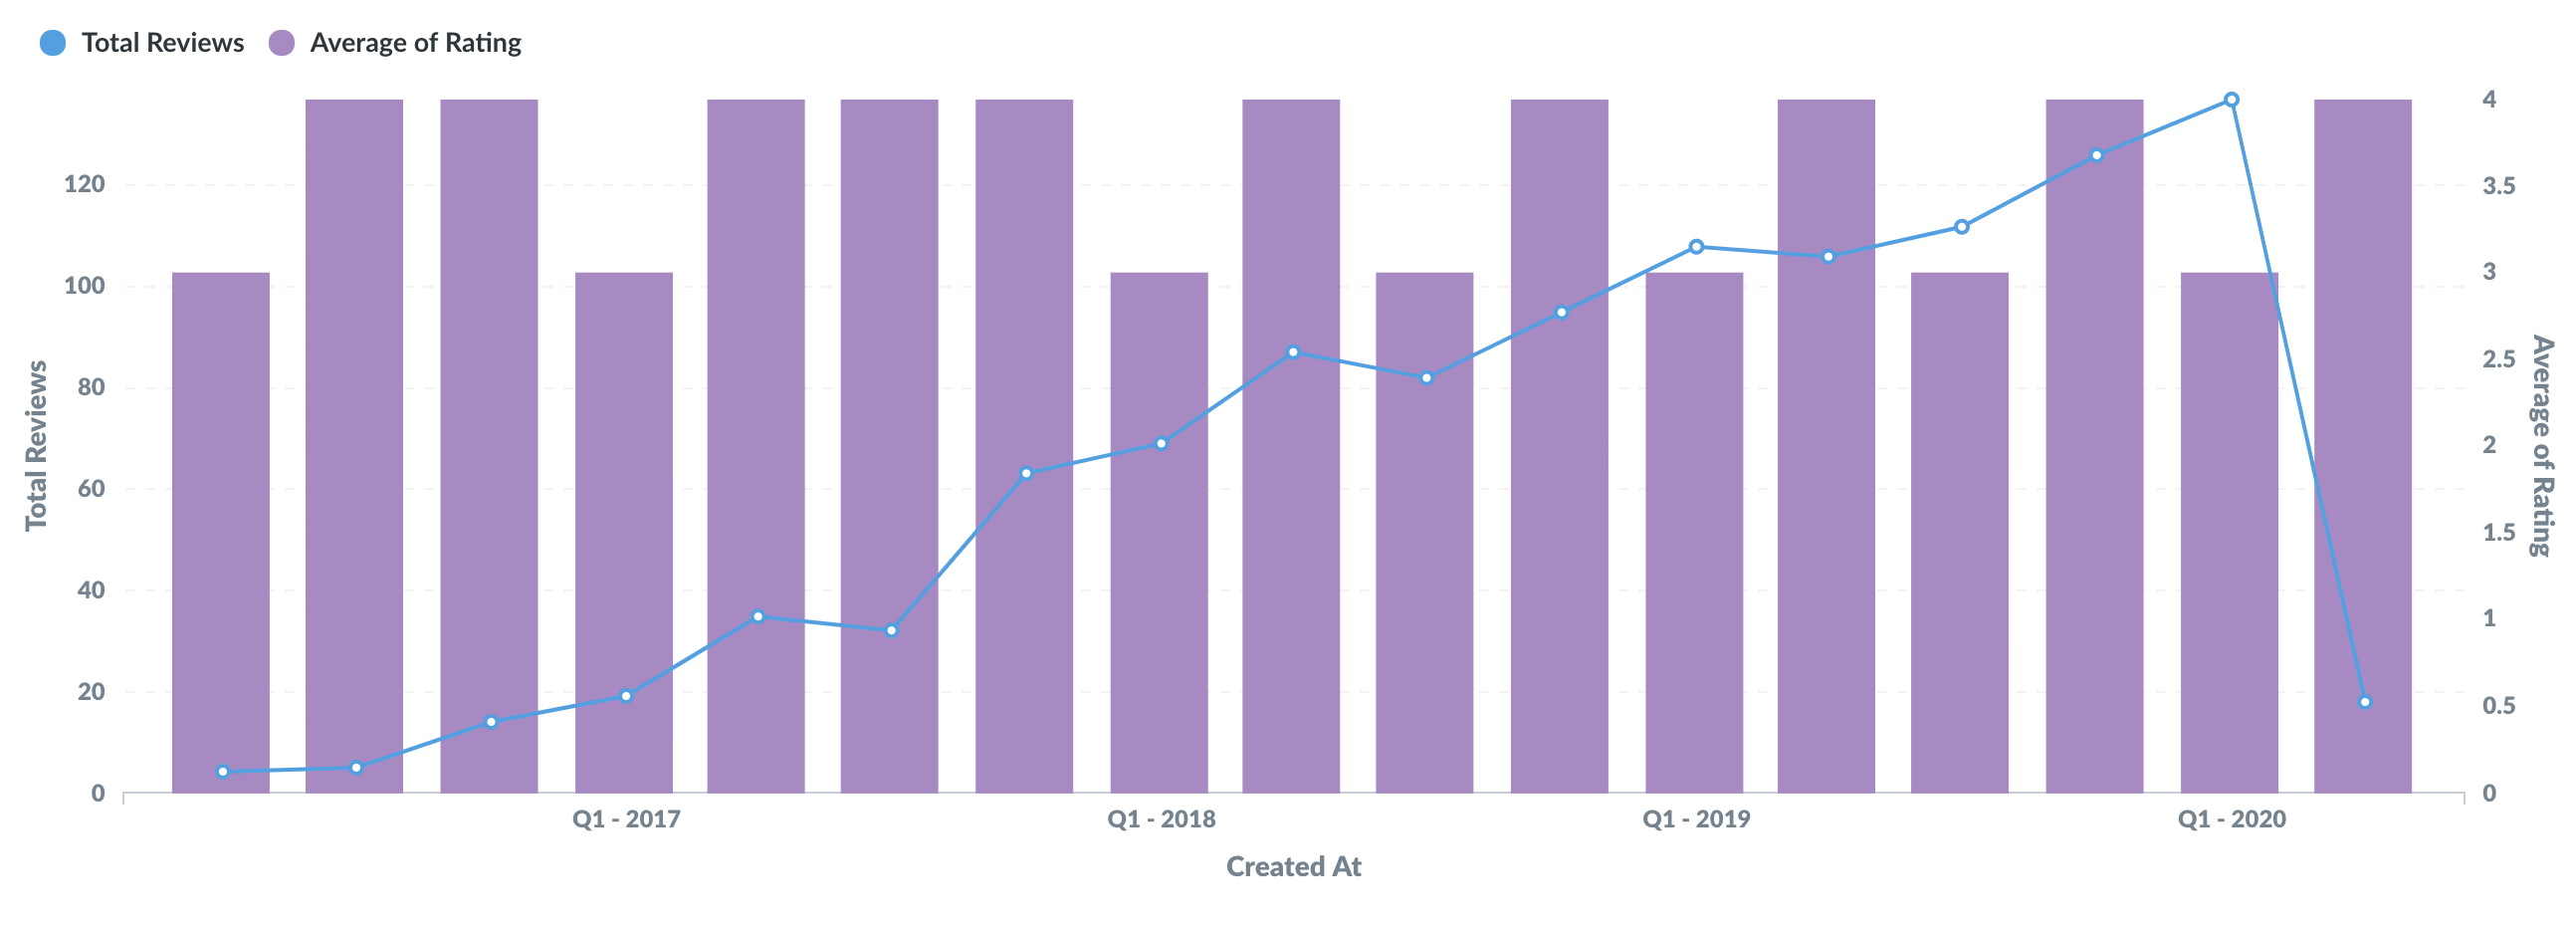
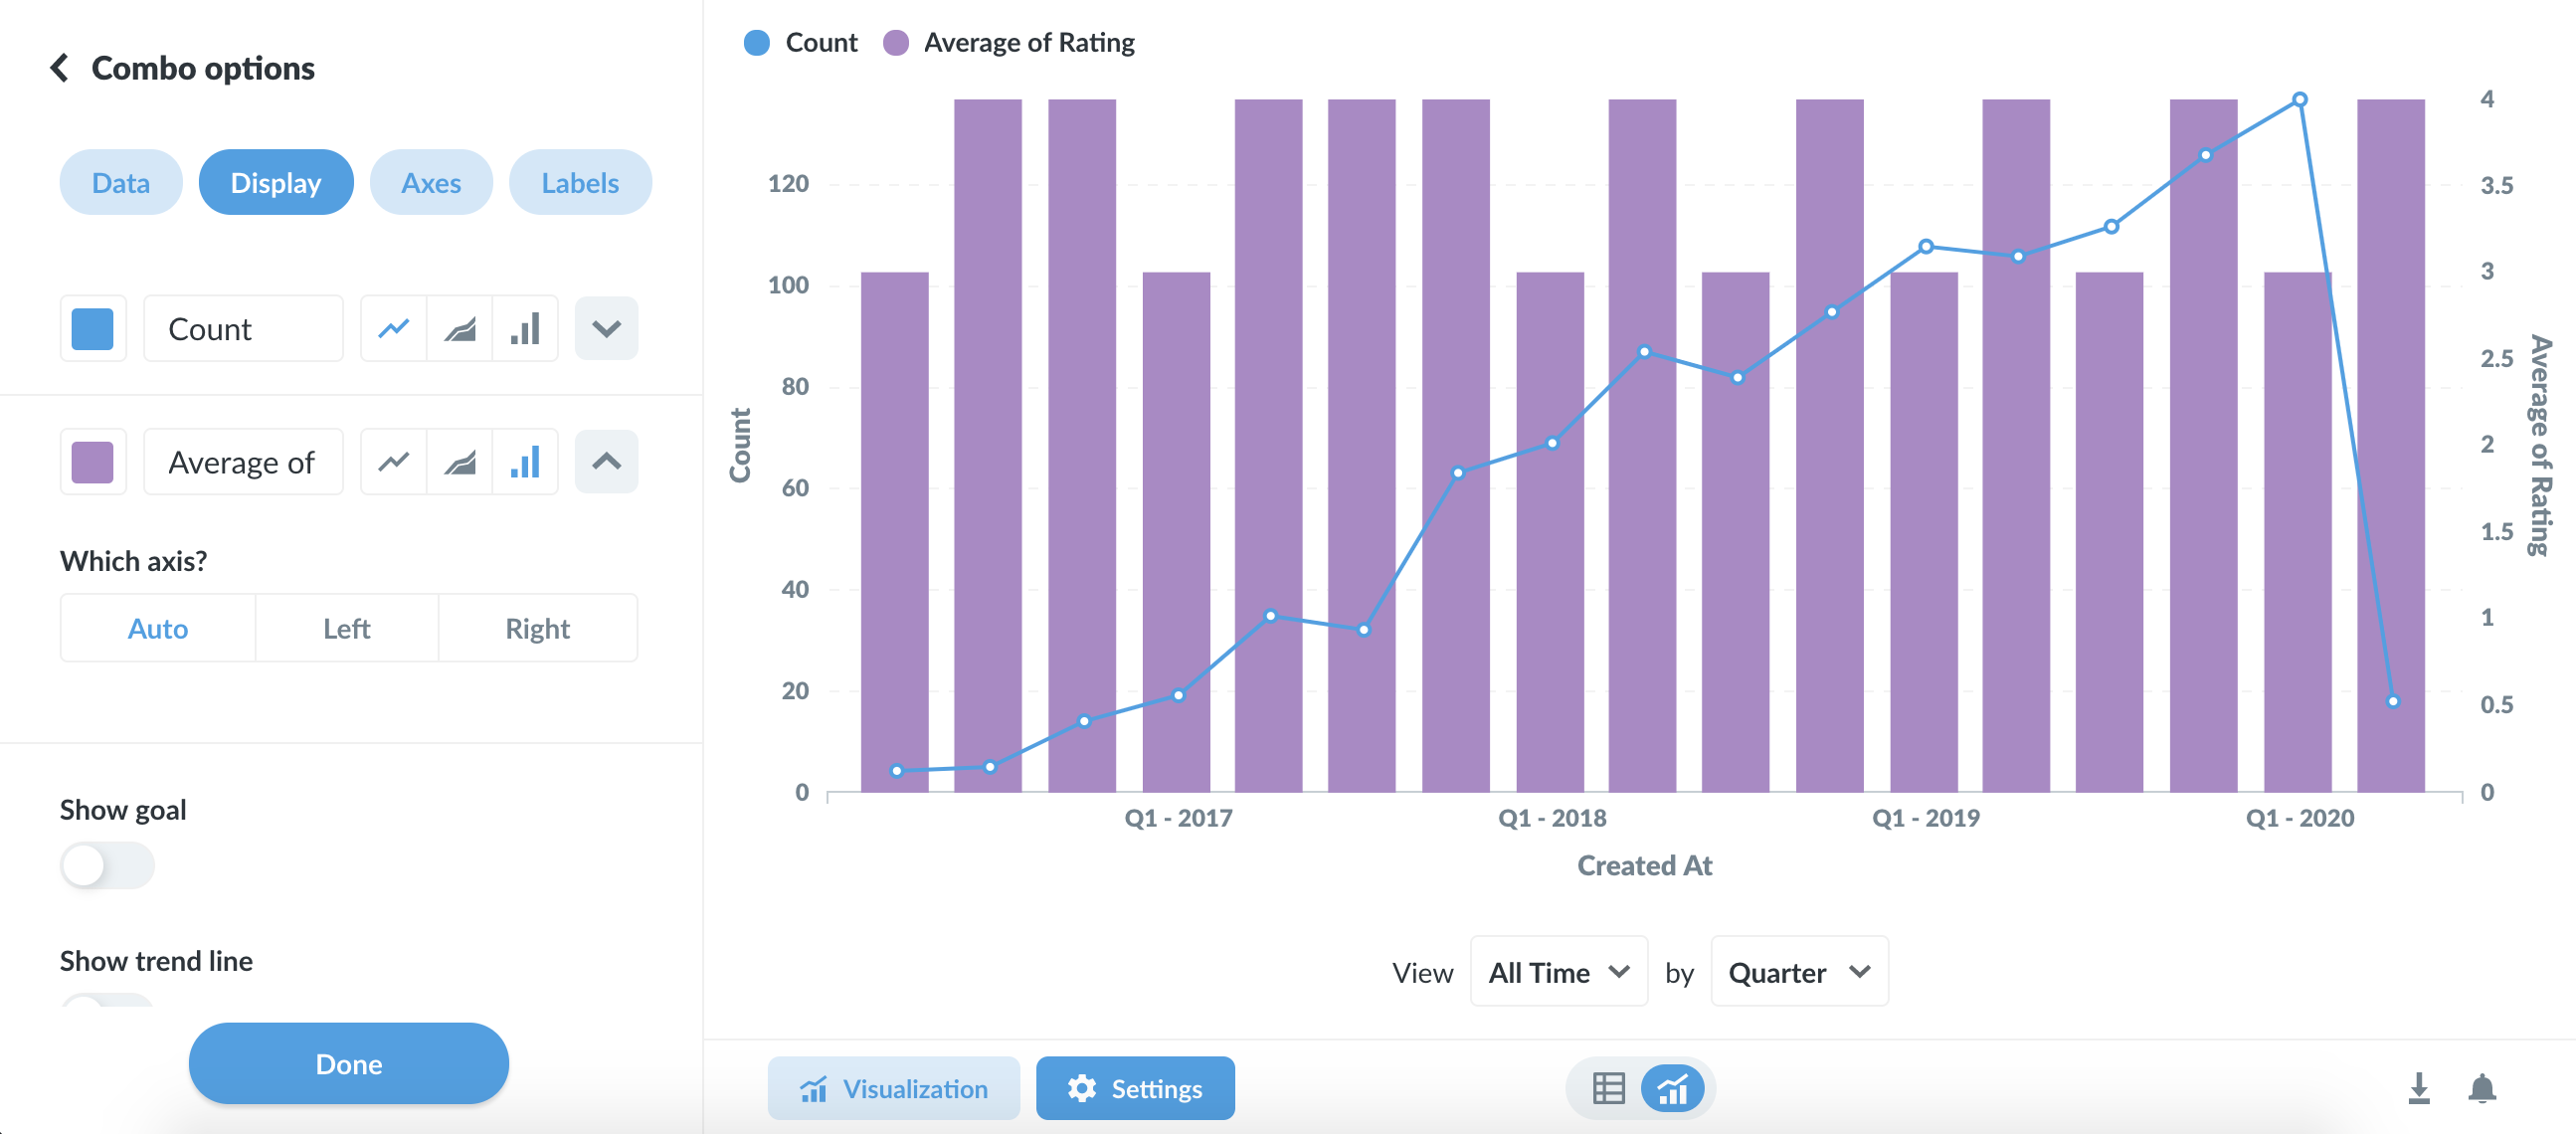
Metabase will pick one of your series to display as a line, and another to display as a bar by default. Open up the visualization settings to change which series are lines, bars, or areas, as well as to change per-series settings like colors. Click the down arrow icon on the right of a series to see additional options:
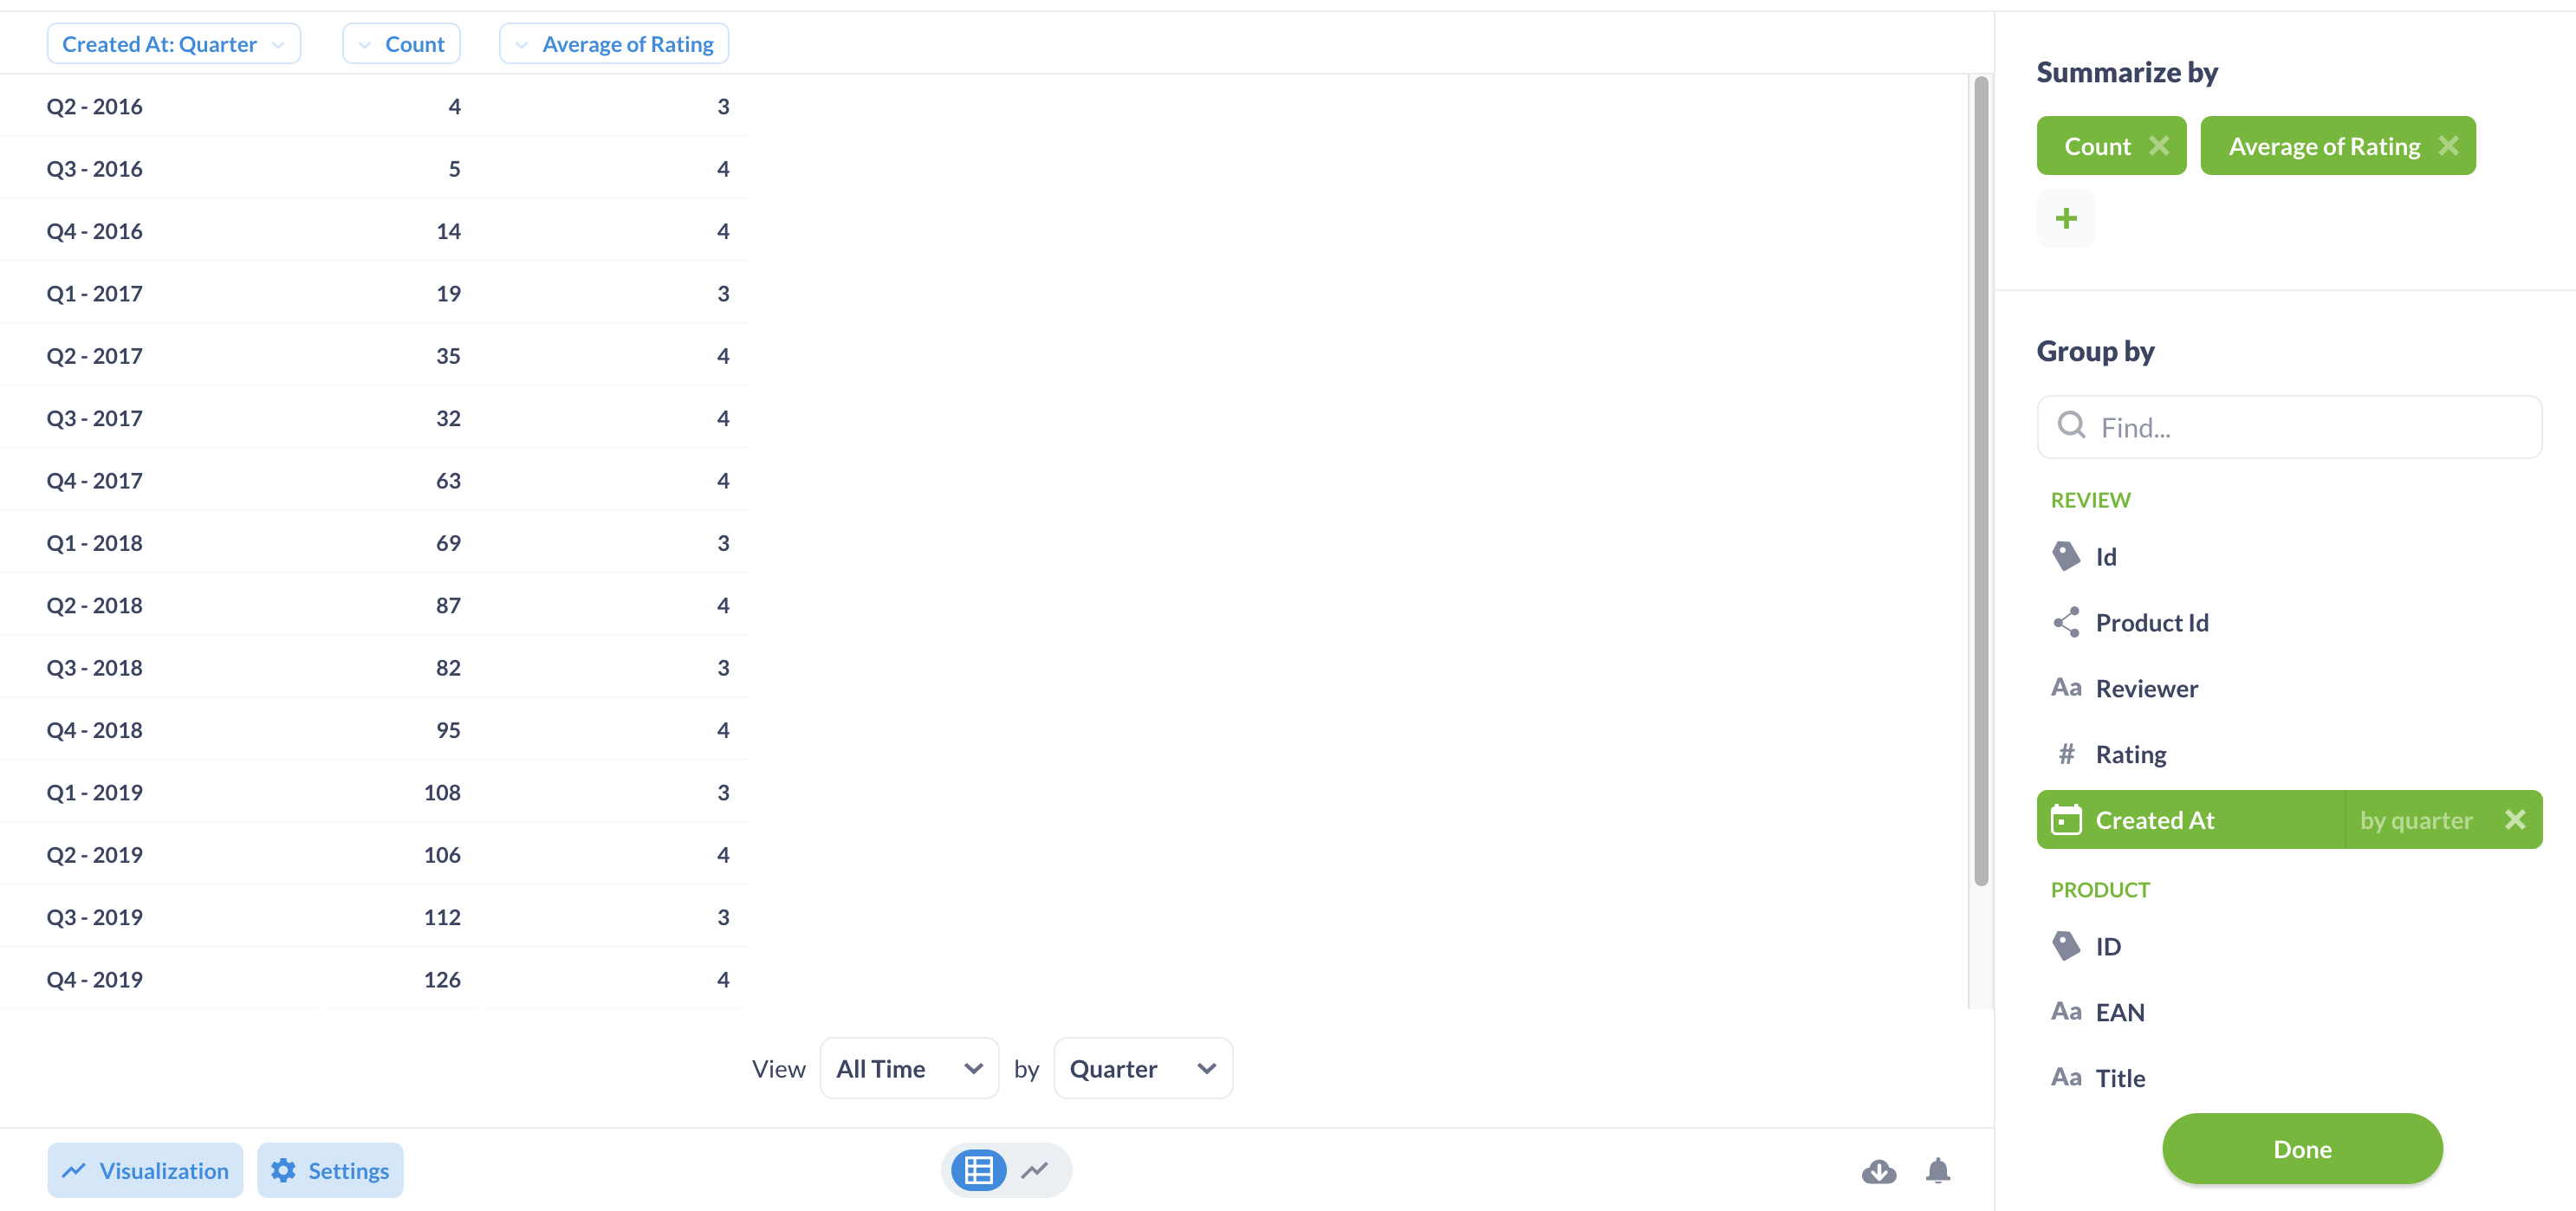
To use a Combo chart you’ll either need to have two or more metrics selected in the Summarize By section of your question, with one or two grouping columns, like this:
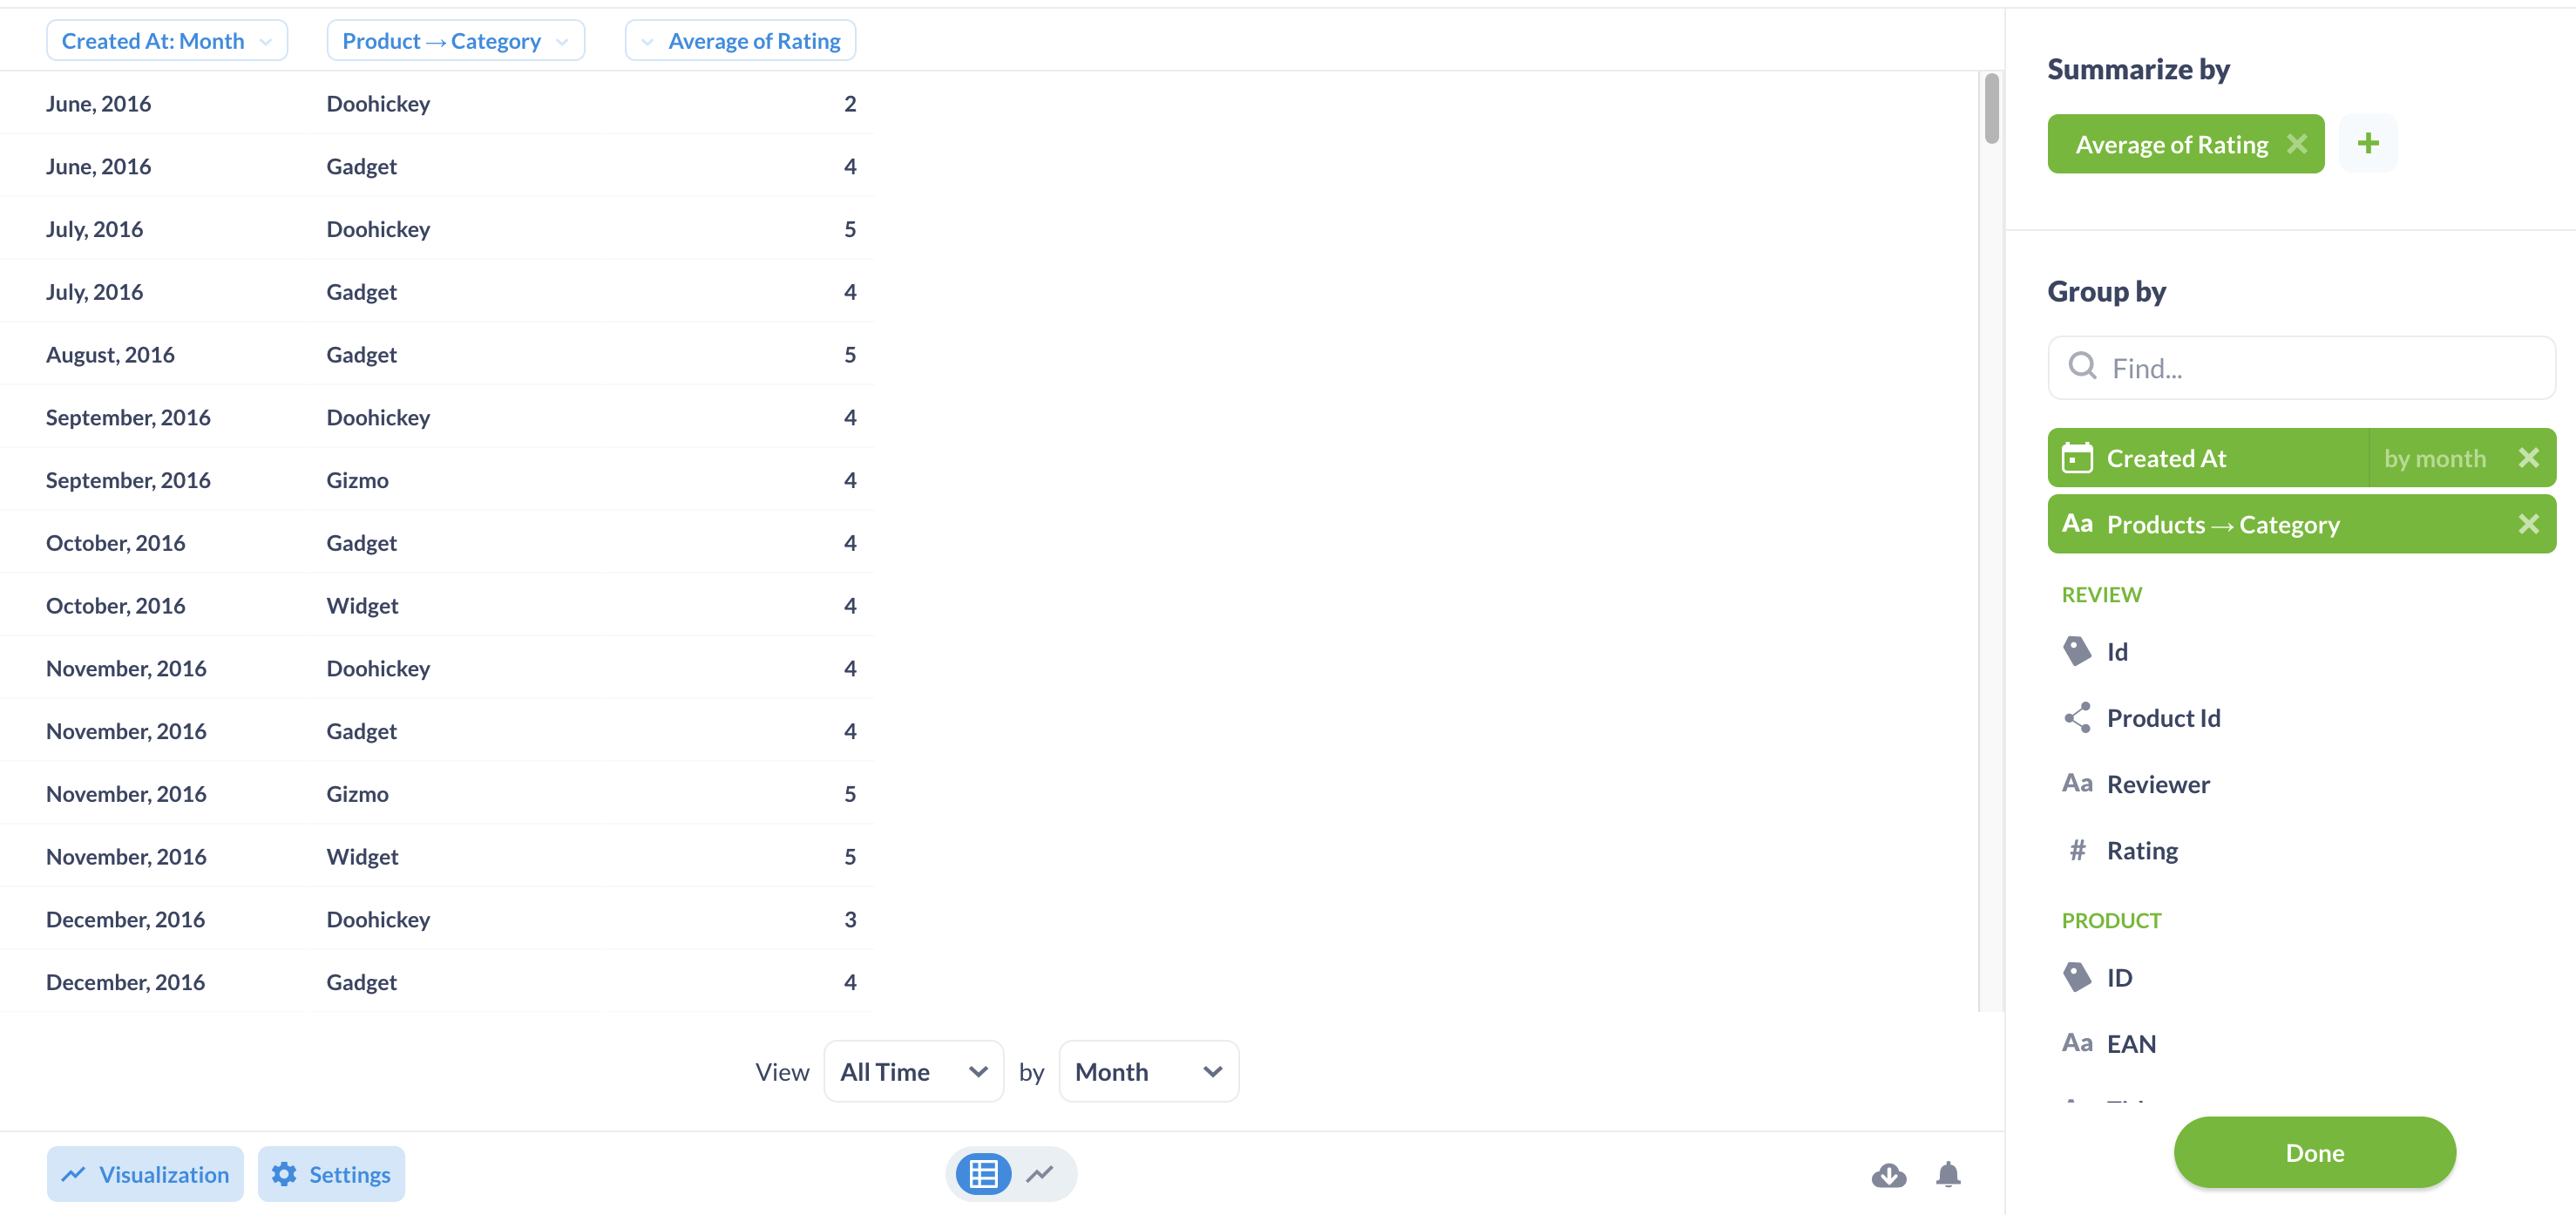
Or you’ll need a question with a single metric and two grouping columns, like this:
Read docs for other versions of Metabase.